
A weak solar maximum, a major volcanic eruption, and possibly even the wobbling of the Sun conspired to make the summer of 1816 one of the most miserable ever recorded.
by Willie Soon and Steven H. Yaskell
First, 1816 marked the midpoint of one of the Sun's extended periods of low magnetic activity, called the Dalton Minimum. This particular minimum lasted from about 1795 to the 1820s. It resembled the earlier Maunder Minimum (about 1645-1715) that was responsible for at least 70 years of abnormally cold weather in the Northern Hemisphere. The Maunder Minimum interval is sandwiched within an even better known cool period known as the Little Ice Age, which lasted from about the 14th through 19th centuries.
But the event that most severely shaped 1816's cold phenomena was the catastrophic eruption the previous year of Tambora on the island of Sumbawa, in modern-day Indonesia. The ash clouds and sulfur aerosols spewed by this volcano were widespread, chilling the climate of the Northern Hemisphere by blocking sunlight with gases and particles.
A third factor also could have played a role. During both the Dalton and the Maunder minima, the Sun shifted its place in the solar system something it does every 178 to 180 years. During this cycle, the Sun moves its position around the solar system's center of mass. This particular trick of gravity is known as inertial solar motion. Scientists have not yet confirmed whether or not inertial solar motion affects Earth's climate directly, but it remains a possibility.
The combined influences of the Sun's changes in magnetism, a major volcanic eruption, and possibly even the wobbling of the Sun's position were responsible for famine, drought, and destructive snows and rains in the Northern Hemisphere in 1816. Diary entries and newspaper accounts abound of the unusual spring and summer cold. People even noted the sky's abnormal color, the large sizes of sunspots, and other curiosities. Because most people in the Northern Hemisphere were subsistence farmers, crop failure meant not only hardship, but often death. Crop yields in parts of America and Europe sank dangerously low for a year, causing eyes to focus on a blotchy Sun and an angry God or both.
A Miserable Summer
The people who survived the drought and cold would long after refer to 1816 as eighteen hundred and froze to death. Sleet fell in the Northeast United States, and snowdrifts remained 2 feet deep in late spring. In Franconia, New Hampshire, 88-year-old physician Edward Holyoke, an amateur astronomer and meteorologist who kept detailed weather records for 80 years, wrote on June 7: exceeding[ly] cold. Ground frozen hard, and squalls of snow through the day. Icicles 12 inches long in the shade at noon day.
Nobody could recall such a cold spring. Sheep froze in meadows and small birds were easily caught by reason of the cold or were found dead in fields. Massachusetts physician William Bentley wrote on June 12: in few seasons have we heard more bitter
complaints against cold weather than since June has come in. Others recorded killer droughts and a strange, tepid dryness wafting on northwest winds. A vivid impression of that summer in the Northeast United States appeared in verse:
The trees were all leafless, the mountains were brown A certain degree of normalcy returned for part of the summer. In some coastal areas, the weather was bland and agreeable, if humid. Spurting vegetable growth could fool anyone: even astute long-time weather observers like Holyoke described June 17 to August 17 as uniformly fine.He wrote in a confident hand that the crop outlook was better than could have been anticipated.
The face of the country was scathed with a frown
And bleak were the hills, and the foliage sere
As had never been seen at that time of the year.
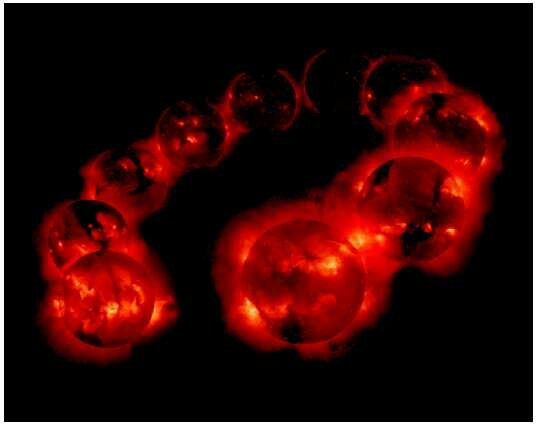
These X-ray images of the Sun from the Japanese/American Yohkoh satellite demonstrate solar activity waxing and waning between the sunspot maxima in 1991 and 2000.
The images, taken at 1-year intervals, show changes in the corona.
The visible surface of the Sun, the photosphere, is so cool (about 6000° C) that it barely emits X-rays, so it appears black in these images.
Courtesy of ISAS and NASA.
But then the cold struck again. On August 21, Holyoke wrote in a tenser hand, recording the frosts and snows that killed off the meager bean and corn crop. The difference between August 17 and 21 was like summer compared with winter. The fields were as empty and white as October.
This particular damaging frost affected areas from southern Canada to North Carolina. Cold struck again on September 11, and people tended fields as if dressed for December. In an age characterized by backbreaking labor, the poverty year, as 1816 was called by some, was a harrowing ordeal.
The bad weather wasn't confined to North America. The summer weather in parts of Europe was so bad that it reminded people of November. On June 16, Mary Wollstonecraft Shelley noted that the weather at Lake Geneva turned abruptly from dry and beautiful to lashing rain, with howling winds and vicious lightning storms. Shelley was spending the cold and rainy summer in Switzerland with various literati. Most were confined indoors on
stormy June 22, where rounds of ghost stories ensued. They pledged to record these fables on paper, and Mary Shelley was the first to prevail (by 1818). As a fruit of her labors, we have the Gothic chiller Frankenstein: Or, the Modern Prometheus.
A Strange Solar MaxFirst, let's focus on how the Sun made 1816 a bad year. The Dalton and Maunder minima were extended periods of very weak solar activity, spanning about 25 years and 70 years, respectively. Records from these periods show far fewer sunspots than normal, meaning the Sun's magnetic activity was very weak during those years. Even though the Sun is covered by relatively few dark sunspots when it is not magnetically active, it also has fewer bright regions, known as plages and faculae. Sustained periods of weak magnetic activity make the Sun slightly dimmer, so Earth receives less solar light energy.
Scientists have recently reconstructed this weak magnetic activity by measuring various chemical isotopes in tree rings, for example, and matching them to weather and temperature oddities. Cosmic rays transmute nitrogen-14 in Earth's upper atmosphere, creating the radioactive isotope carbon-14. In the 1970s, solar astronomer John Eddy of the High Altitude Observatory in Boulder, Colorado showed that carbon-14 concentration in annual tree growth rings is higher when fewer sunspots blemish the Sun's surface.
There's an astronomical explanation for this linkage. Strong magnetic activity on the Sun is passed on to the solar wind a stream of protons and helium nuclei flowing outward from the Sun at high speed. A strong magnetic field in the solar wind shields Earth from cosmic rays. Because fewer cosmic rays collide with Earth, less carbon-14 forms in the atmosphere. But when solar magnetism is weak, more galactic cosmic rays can reach Earth and make more carbon-14. The carbon-14 in turn combines with oxygen molecules in the atmosphere to make the heavy version of carbon dioxide that will ultimately be incorporated into the cellulose of growth rings of living trees.
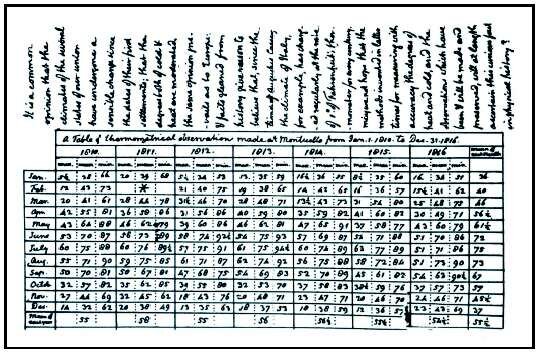
From his Monticello home in Virginia, Thomas Jefferson recorded the severe weather of 1816 in his weather diary.
Jefferson was just one of many observers who recorded unusually cold weather during the summer of 1816.
And the strange weather was not confined to eastern North America. Bad weather was recorded all over the world. The cold and rainy summer in Switzerland even inspired Mary Wollstonecraft Shelley to write Frankenstein.
Courtesy of the Jefferson papers, Manuscript Division, Library of Congress, Gerard W. Gawalt.
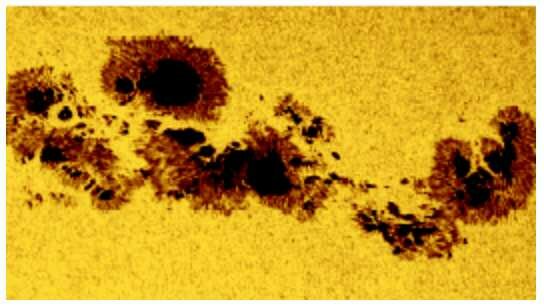
Suspicious 19th-century eyes turned upward at an angry God, and at the Sun. Fingers pointed to a spotty Sun as the culprit for the strange and unpredictable weather. In 1816 sunspots were so large that they could be seen without telescopes. One report notes the presence of particularly large sunspots from May 3 to 10, and again on June 11, when a dry fog due to Tambora's effects reddened and dimmed the disk of the Sun. This reddened condition acted as a solar filter and made the large sunspots stand out easily, even to unaided eyes. The sunspots made quite an impact on the average person, who at the time believed that the large spots appearing on the Sun's disk lessened the number of rays of light and consequently the earth was to that extent cooler than usual, wrote Sidney Perley in the 1891 book Historic Storms of New England.
The dark spots certainly dimmed sunlight, but the spots alone couldn't explain the unseasonable cold and snow. If sunspots were the only culprit, the cooling effects from the reduced sunlight should have come and gone through each 27-day solar rotation. In addition, large sunspots seldom last longer than a month, which would otherwise be necessary to explain the extended period of cooling.
Ironically, 1816 occurred around the maximum of the Sun's 11-year sunspot cycle. But the sunspot groups counted in 1816 amounted to a mere 35, as opposed to about 100 for a normal year around solar maximum. This is about the lowest sunspot maximum ever recorded, so astronomers call it a weak solar maximum.A person on the street might have accused the Sun of causing the bad weather, but sunspots alone weren't doing the chilling and killing. We must look deeper for the culprit and right into the Sun's magnetic cycles. The cause of the Sun's magnetic activity cycles is still a pressing research topic.
Inasmuch as 1816 was a weak solar maximum, the question lingers of how much the dimmed Sun affected global cooling. But compared with Tambora's eruption, the Sun played just a minor role in cooling Earth, at least for that year. Still, the Sun's cooling effects could have gradually begun long before 1816.
Tambora's Fury
Tambora's eruption activity peaked on April 10 and 11, 1815. Approximately 90,000 people perished on and around Sumbawa Island in the Java Sea many from famine in the eruption's aftermath. Tambora's eruptive force, mortality, and atmospheric impact exceeded anything like it on Earth in the past 10,000 years. The catastrophic eruption was so powerful that it sheared Tambora nearly in half, from 4,300 to 2,850 meters. Tambora's dust funnel pumped 200 megatons of dust, rock, and aerosols into the stratosphere. In the immediate aftermath, violent winds blew throughout the area and pumice chunks 20 centimeters long rained down on the surrounding region. Floating ash islands formed in the sea and a tsunami ravaged nearby shorelines.

While not nearly as violent as Tambora's 1815 eruption, the June 1991 eruption of Mount Pinatubo in the Philippines devastated the local region and caused a global cooling that lasted a year or two.
Heeding warnings from geolo-gists, the Philippine government evacuated the region prior to the main eruption, keeping loss of life to a minimum.
In contrast,Tambora's eruption and aftereffects killed 90,000 people.
Courtesy of the United States Department of the Interior, U.S. Geological Survey, and David A. Johnston (Cascades Volcano Observatory).
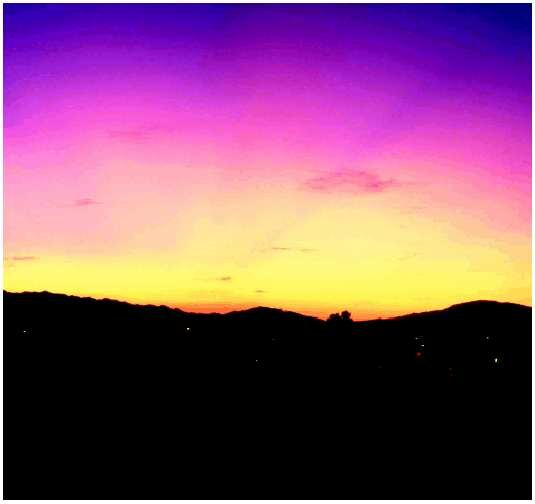
Darkness covered the area for days, with hot and cold air pockets wafting about. All of this destruction occurred far from European and American eyes. But astronomers throughout Europe observed dimmer stars in 1815 most significantly from September 6 to 20. On these days, and at later times, people in different locations around the world saw strikingly beautiful sunsets characterized by red, white, and yellow bands. These spectacular sunsets resulted from volcanic aerosols and dust thrown into the troposphere and stratosphere.

Tambora appears serene in these images from an airplane (top left) and from the space shuttle (top right), but in 1815 it produced the most powerful volcanic eruption of the past 10,000 years.
The explosion sheared the volcano nearly in half and ejected an incredible 50 cubic kilometers of material into the atmosphere.
Tambora lies on the island of Sumbawa in Indonesia. Only 26 of the island's 12,000 inhabitants survived the eruption.
Top left image courtesy of Rizal Dasoeki,Volcanological Survey of Indonesia.
Top right image courtesy of NASA. Map courtesy of Tom Ford.
Similar effects were seen worldwide from the 1991 eruption of Mount Pinatubo in the Philippines, but on a smaller scale. Even though Benjamin Franklin noted the connection between cool, dim years and volcanic activity as early as 1784, there has been no documented evidence that scientists or the public of 1816 made the same link between Tambora's eruption and their unusual weather. Ironically, the Northern Hemisphere had been experiencing a temporary warming temperature excursion prior to the eruption, rising from an earlier cooling trend that could have thrown the scientists off track. Sulfate aerosol particles, made from volcanic gas and dust, blocked some of the Sun's heat. Scientists today generally agree that these aerosols were the main culprit of the year without a summer.
The atmospheric ash affected some regions more heavily than others. The reconstructed regional pressure map for 1816 suggests that the volcanic aerosol clouds made the air pressure at sea level drop significantly across the North Atlantic's mid-latitudes, pushing midlatitude cyclone tracks southward. A lowpressure zone that today sits over Iceland was displaced southward over England, which brought in wetter weather over Western Europe. Weather maps restored by the late British climatologist Hubert Lamb indicate that the average latitude of subpolar Icelandic low-pressure centers in July from 1811 to 1820 was about 61° N. In contrast, when sunspots were in higher abundance between 1925 and 1934, the low-pressure center was displaced some 6° farther north.
In cases where the temperature was cold enough that summer (like in the Northeastern
United States), snow started to fall in June and often failed to melt. A dimmer Sun could have helped spread or move the center for the North Atlantic low-pressure system sufficiently southward from Iceland to the British Isles to intensify volcanic dust and aerosol effects from Tambora. Cool polar air also could have penetrated farther south toward eastern North America in the Dalton Minimum.
Considering these factors, it's easy to see how Tambora's eruption, combined with weak solar activity, could work together to make terrible or just weird weather and unusual sunset colors in and around 1816. Recent research by Tim Ball, Mike Chenoweth, Dick Harrington, Cynthia Wilson, and other scientists has expanded the recording of anomalous conditions in 1816 to Greenland, Alaska, northeast Brazil, the tropical Atlantic, the eastern Pacific (by the Galapagos Islands), India, Tibet, South Africa, and elsewhere.
The Wobbling Sun
Were other factors at work, adding to the reduced solar flux and to the terrible ill effects from Tambora? The Sun's position in space moves about the solar system's center of mass (barycenter) in cycles that repeat themselves every 178 to 180 years. This wobbling motion is caused by the gravitational tug of the planets (mainly Jupiter and Saturn) and is similar to the stellar motions that Geoff Marcy, Paul Butler, Michel Mayor, Didier Queloz, Bob Noyes, Pete Nisenson, and other astronomers observe to detect extrasolar planets.
Important years pertinent to this article for inertial solar motion the barycenter shift are 1632, 1811, and 1990.
What's the connection, then, between inertial solar motion and a cold 1816, the eruption of Tambora aside? Inertial motion theory supporters state that perhaps it is no accident that the timing of the first two years (1632 and 1811) corresponds to the two weakest sunspot activity periods ever recorded: 1645-1715 (Maunder Minimum) and 1795-1823 (Dalton Minimum). This correlation suggests that the 1816 events can be linked to the Sun's motion around the barycenter. But just how they are linked if at all is another matter altogether.
In addition, some studies suggest direct connections (without the Sun's radiation intervening) between the Sun's inertial motion dynamics and phenomena on Earth such as earthquakes, volcanic eruptions, massive rainfall, surface air temperatures, and so on. It must be emphasized that from a hard science perspective, nobody has identified any plausible physical mechanisms to support this unproved but intriguing hypothesis. We must ask more insightful questions in order to offer explanations for the many phenomena exhibited by the Sun's magnetic field. One solar inertial motion model predicts that a prolonged solar magnetic activity minimum will occur somewhere between 1990 and 2013. This prolonged minimum is expected to end around 2091.
That solar activity has direct or consistent control over Earth's climate (see A Sun-Climate Connection? below). But when specific natural phenomena align, as was the case in 1816 with the Sun and Tambora, adverse effects can affect Earth's climate and population in the short term.
The bad weather in 1816 occurred at a period in human history when science literacy was on the rise. But like dentistry and surgery at the time, scientific knowledge was still rather primitive and thinly spread among the populace. Matters like barycenter shifts and 11-year sunspot cycles were still unknown. Even Benjamin Franklin's pithy geophysical observations were ignored. But according to Percy Bysshe Shelley, one thing is certain:
The fountains mingle with the river
And the rivers with the ocean.
The winds of heaven mix forever.
WILLIE SOON is a physicist at the Harvard-Smithsonian Center for Astrophysics and the Mount Wilson Observatory. He is also a senior scientist at the George C. Marshall Institute and the senior science contributor to the environmental science page at www.techcentralstation.com.
STEVEN H. YASKELL works for Ericsson Radio Systems in Sweden and is a writer and natural historian focusing on aspects in the history of science. World Scientific Publishing Company will publish their book manuscript about the Maunder Minimum in 2003.
Given our current state of knowledge, no responsible scientist would state definitively the Sun goes through activity cycles that last nearly 11 years on average. These cycles are driven by magnetic fields, which generate sunspots, flares, bright regions known as faculae, and other disturbances. For these reasons, the Sun's luminosity changes from year to year. These changes have a subtle but important influence on Earth's climate. In the last two decades satellites have shown that when the Sun's magnetic activity is near maximum, the Sun is about 0.15% brighter than when activity is near minimum. In addition, satellites may have observed that the Sun was 0.05% brighter at the 1996 solar minimum than it was during the 1986 solar minimum.
One might think that an inactive Sun would be brighter, because dark sunspots cover more of the Sun's surface near solar maximum. But faculae are also more common around solar maximum, and when the Sun is active, the overall brightening from these faculae dominates the darkening of sunspots. So an active Sun is brighter than an inactive Sun.
Astronomers have reasons to believe that other mechanisms acting over longer time scales, such as changes in temperature, also lead to changes in solar luminosity. If the Sun's temperature changes, convective motions deep inside the Sun will also vary. Localized changes in solar convection lead to changes in sunspot decay and structure. A global change in convection will lead to changes in the length of the solar cycle or the solar diameter. Astronomers have observed sunspot structure and solar cycle length varying in the same way over the last century, which indicate a peak in solar luminosity in the late 1930s and minima around 1880 and 1975. These changes in solar luminosity have closely paralleled changes in Earth's temperature, suggesting a physical cause-effect relationship.
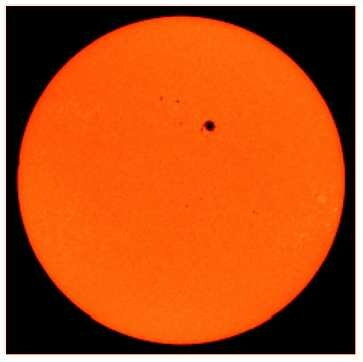
On March 7, 2003, the Sun's disk was blemished by a sunspot large enough to be seen without optical aid.
After Tambora's eruption, people around the world also noticed naked-eye sunspots. The same magnetic activity that produces sunspots also produces bright regions known as plages and faculae.
The increased luminosity from these features more than compensa-tes for sunspot dimming. But the overall influence of changing solar energy output on Earth's climate remains uncertain.
Courtesy of SOHO/MIDI.
The Sun's activity undergoes long-term changes in intensity. In periods such as 1645-1715 (the Maunder Minimum), many years can pass without a single sunspot being observed. Many of the sunspots that were seen during this period persisted for several solar rotations, indicating they decayed very slowly, implying reduced solar convection and luminosity.
The Maunder Minimum coincided with some of Earth's coolest climates of the past millennium. The most recent grand minimum was the Dalton Minimum, which occurred around 1790-1820. It was much shorter than the Maunder Minimum, and astronomers observed low levels of solar activity nearly every year. The year 1810 was the last full calendar year without any sunspots being observed. Solar cycles during the Dalton Minimum lasted about 14 years on average, compared with the modern average of 10.7 years. This solar behavior is consistent with a reduced solar luminosity and should be accompanied by a cooler climate on Earth.
Indeed, as Willie Soon and Steven Yaskell's article explains, 1816 was known as the year without a summer in New England, and cold weather was felt around the globe. Although Tambora's eruption in 1815 was a major contributor to the cool weather, a number of cool years preceded 1816, which may have been caused by a dimmer Sun.
Astronomers have estimated that the Sun was fainter during the Maunder Minimum by anywhere from 0 to about 0.7%, with a decrease of 0.3% being a popular figure. This latter number is thought to be too small to explain climate changes, so other indirect solar effects such as changes in cosmic ray intensity modulated by changes in solar magnetic field strength may have contributed to climate change. Or there may have been some indirect effect that is yet unknown. The level of solar activity over the next century is still being debated. Some astronomers think solar activity will continue to increase, but others expect another grand minimum to appear because the Sun is overdue for one.
DOUGLAS HOYT is a retired solar physicist and climatologist who has worked for Raytheon, the National Oceanic and Atmospheric Administration, and the National Center for Atmospheric Research. In 1979 he discussed the correlation between variations in sunspot structure and climate. He has published nearly 100 papers on Earth's radiation budget, solar irradiance monitoring, cloud cover variations, aerosols, volcanic eruptions, and many other topics.